How to Read a Kindara Chart
Taking and recording your temperature combined with tracking and interpreting cervical mucus signs are what makes up the Fertility Awareness Method (FAM). I frequently ask my clients to track their cycles in order to monitor period health, hormonal symptoms, and timing of ovulation.
Cycle tracking is incredibly beneficial when you trying to conceive, as it provides you with information about your fertile window. And for the very same reason, it is a great resource to use when you are not trying to conceive, as it can be used as a method of contraception.
The benefits of using FAM include:
– Using non-hormonal contraception
– Knowing when you ovulate
– Being aware of your fertile and infertile windows
– Assisting you in trying to conceive (TTC) or trying to avoid (TTA)
– Learning more about your cycle
– Improving awareness of your body
– Understanding your hormone fluctuations and how they make you feel
I recommend the app Kindara for recording your temperature, cervical mucus, ovulation, and additional signs and symptoms related to your unique cycle that can be tracked. This blog will help you with the basics on how to enter data and interpret a Kindara chart. For information on basal body temperature (BBT) tracking, see this blog.
When using Kindara or any other cycle tracking apps, I recommend turning off or not relying on the ovulation prediction feature. These predictions are algorithm based and rely on previous cycle data to predict your future ovulation dates. The margin of error here is quite high, as we know women can ovulate on different days of their cycle every single month!
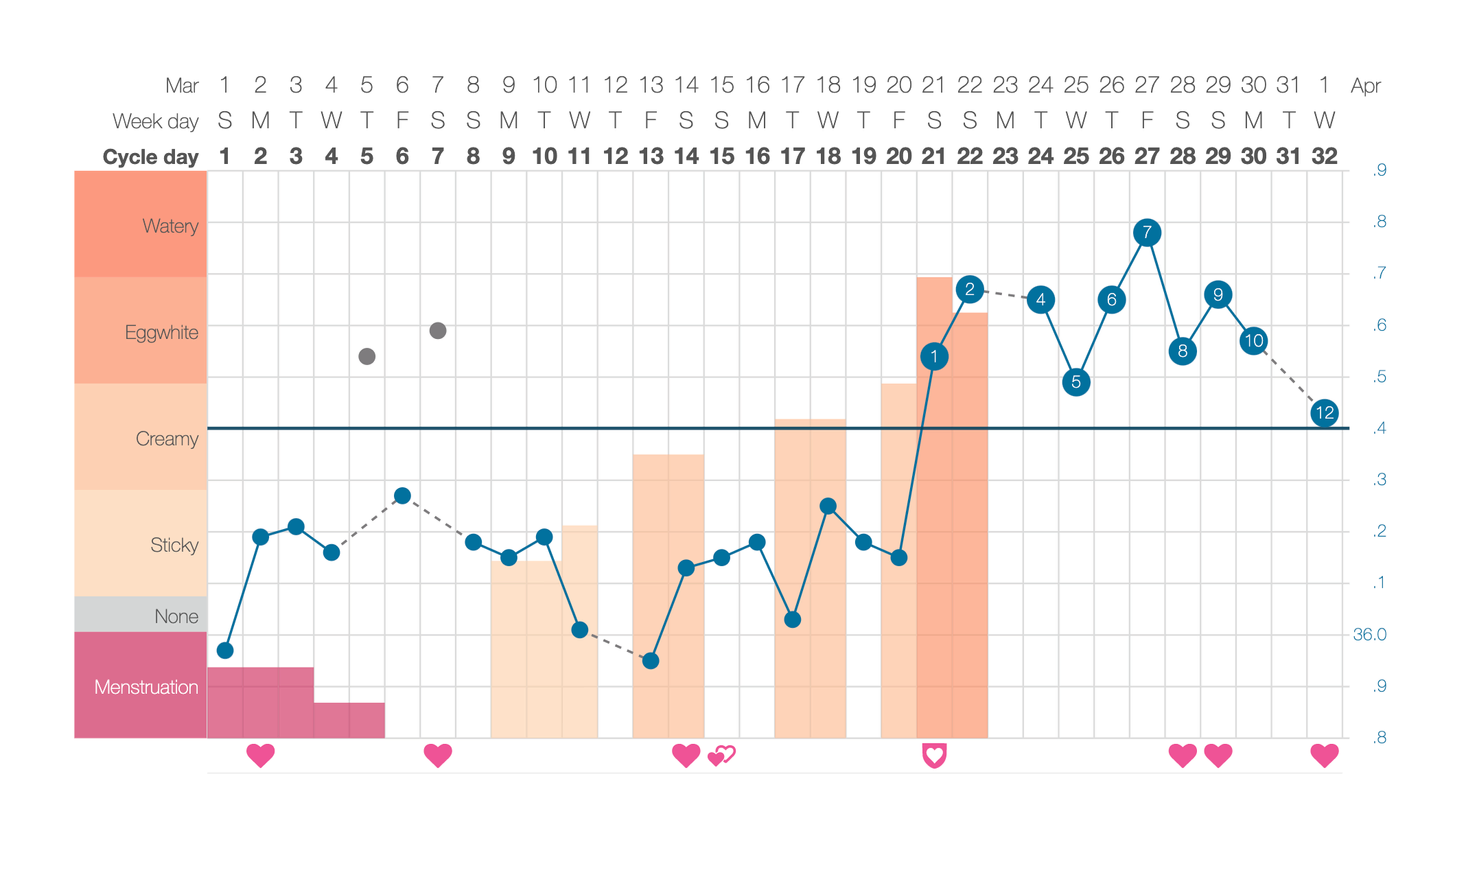
Once you have entered a full cycles worth of temperatures, your chart may look a little something like the below. Note that this is a very straightforward looking chart, I choose this one on purpose for ease of explanation. Many charts do not look like this, so please don’t worry if your chart does note look as ‘neat’ or easy to interpret as this one!
Reading the Basics
On the left hand side we are looking at different classifications of cervical mucus. This is also known as fertile mucus. You will also see colour options for no mucus or ‘dry days’ as grey, as well as menstruation which is pink. You will see these colours logged on different days of the chart, correlating with what this user noticed on that day.
The top line on this chart is the date, underneath that is the day of the week, followed by the cycle day (CD). In this chart the date and the CD are the same, which is uncommon. This is because the user’s new cycle, starting on day 1 of the period, began on the first of the month.
Along the right hand side of this chart we see the temperatures, written in Celsius.
Along the bottom of the chart we see hearts when this user has intercourse.
Coloured hearts = sex without protection
Two hearts = withdrawal method was used
Outlined hearts = sex with protection
Additionally:
– Navy dots on the chart indicate temperatures
– Broken lines indicated days where temperature was not recorded
– Grey dots indicate ‘ruled out’ temperatures (more on this below)
Interpreting Your Chart
We can see that menstruation occurred from CDs 1 – 5 of this cycle, with the heavier days being days 1 – 3, and lighter days being CDs 5 and 6.
Cervical mucus was logged from CD 9 to CD 22. It ranged from sticky, to creamy, to egg white, and then disappeared.
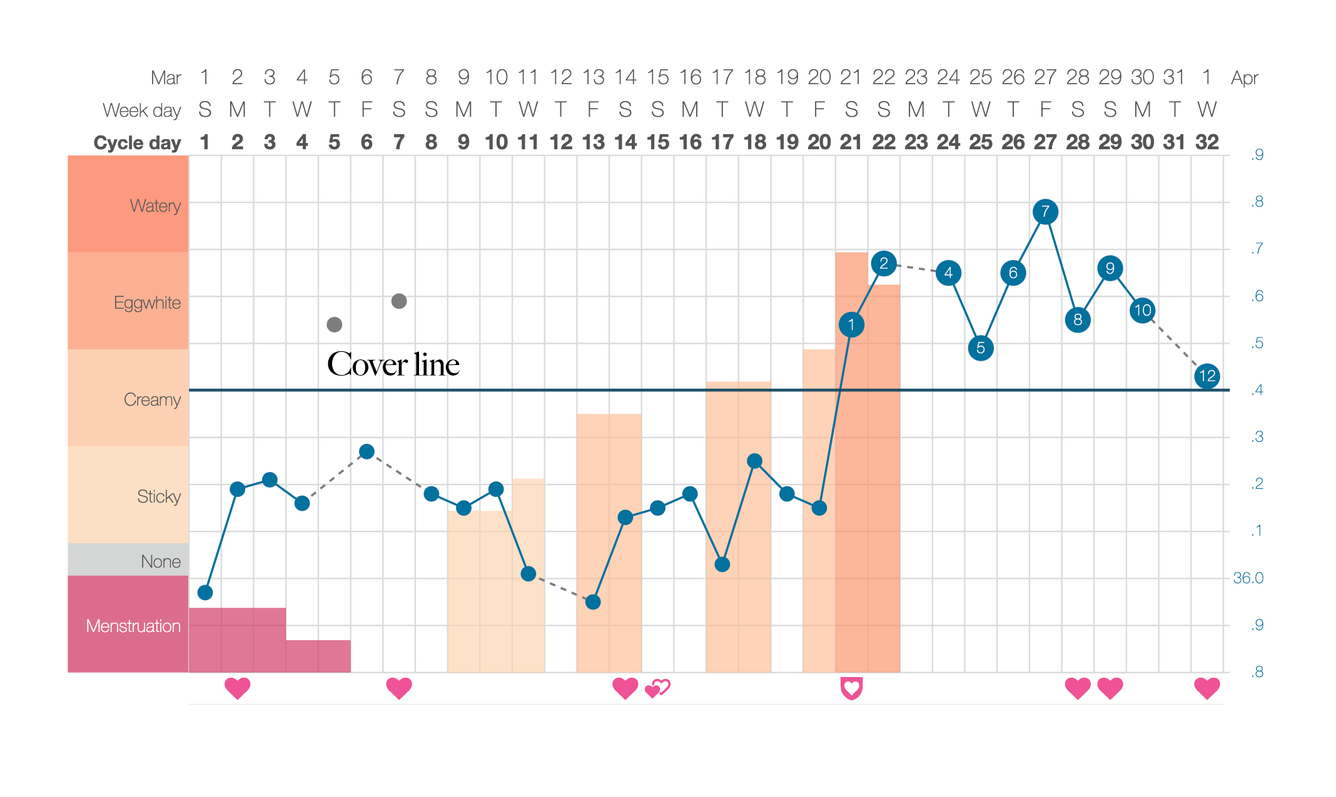
Note the navy cover line sitting at 36.4 degrees Celsius. The cover line separates pre-ovulatory and post-ovulatory temperatures, and therefore our follicular and luteal phases. The temperature of this line will be different for every person, and may change month to month. To add a cover line to your Kindara chart, press and hold your finger down anywhere on your chart. A line will pop up that you can move around.
Determining Ovulation
REFERENCES
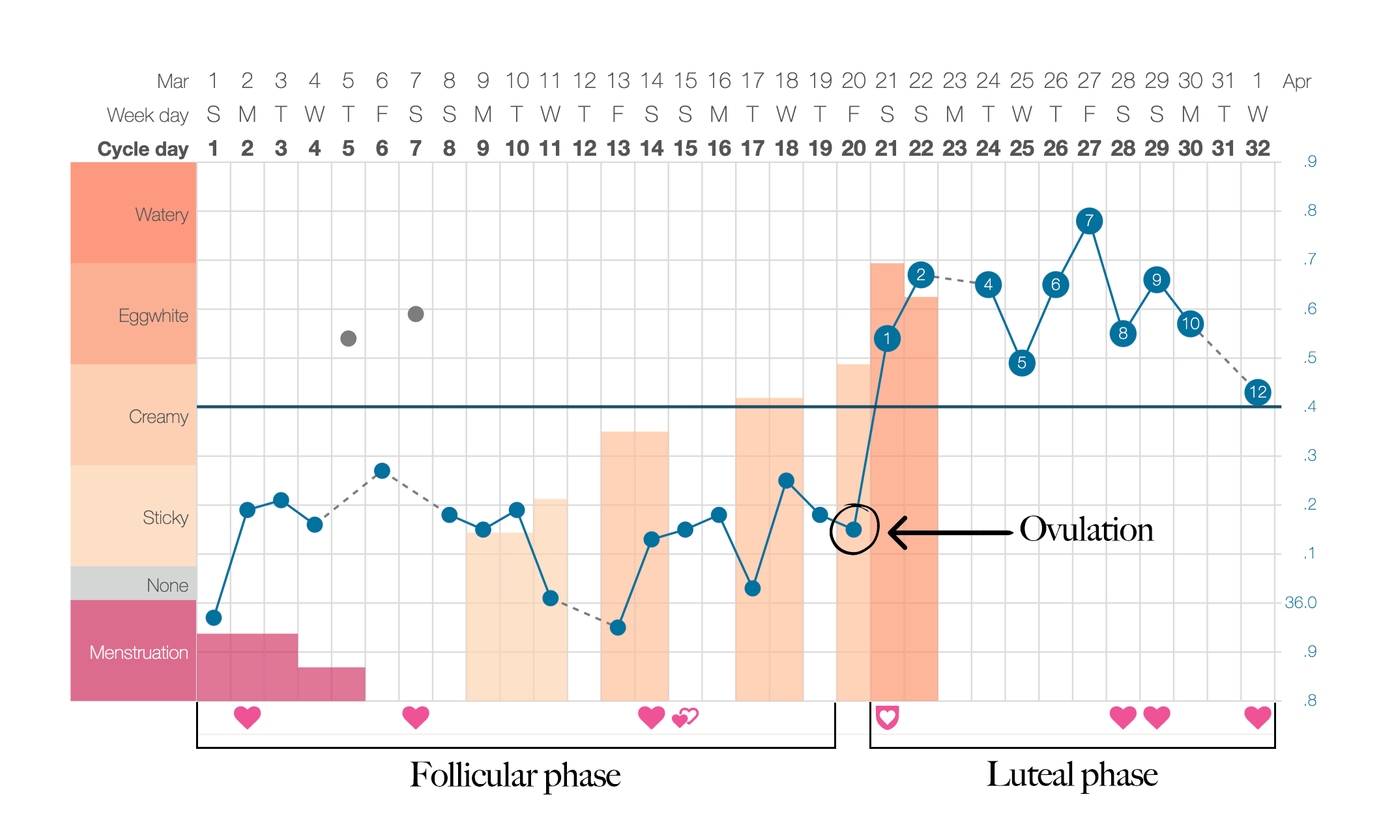
Ovulation is detected by sustained temperate elevation. We can see this occurring from CD 21 onwards in this chart, accompanied by egg white cervical mucus being logged.
Ovulation can only be determined in hindsight, as progesterone is what makes the temperatures rise, and progesterone is only produced in abundance post-ovulation.
This means that ovulation occurs before the temperature shift occurs – which we can observe occurring on day 20 of this cycle. It is important to highlight that this is not the traditional day 14 ovulation day that is often quoted. Ovulation doesn’t automatically occur on day 14, nor the same day of each month, and cycles are not always 28 days!
All bodies are different and unique, as are our hormones.
This chart shows a luteal phase of 12 days, as we can see by the numbers written on these elevated temperatures. To have these numbers show up in your chart, double click the day your temperature first rose, and at the upper right hand corner of the app click ‘temp. shift’.
TTC or TTA?
Depending on why you are tracking your cycle – contraception, conception, or simply learning more about your body – you can track as little or as much data as you like.
You don’t have to track and enter cervical mucus if you don’t want to, you may just like to start with your temperatures and see how they look over a few cycles.
Additional Tips:
The stand-alone grey dots are temperatures there have been entered that look unusually high or abnormal to the user, and were then ‘ruled out’ on the app. To rule out a temperature, go into the days data, enter your temperature, and then click on ‘questionable’. This is helpful in making your chart easier to read if you know your temperature looks unusual.
Abnormal temperatures can be due to the following reasons:
– Interrupted sleep
– Oversleeping
– Different sleeping hours to usual
– Taking your temperature earlier/later than usual
– Shift work
– Drinking alcohol the night before
– Being unwell, having a fever
– Travel
– Certain medications
Some people may find that their temperature drops the day before or the day their period arrives. This is a very helpful sign in knowing that your period is on it’s way! We can observe this occurring on CD 32 on the chart above.
I hope you have found this blog helpful to get you started tracking and interpreting your cycle on Kindara. I have provided a lot of information and detail here, however once you start using the app yourself, things will make a lot sense to you!
If you are currently trying to conceive, you may find my blogs on this topic helpful. They can be found here and here.
Please leave any questions you have for me about cycle tracking, Kindara, or your hormone health below.
If you’re interested in booking in a base chat or initial session with me, you can do so here.
Jaclyn is a qualified Naturopath with a focus on hormonal complaints, reproductive and fertility care, skin, and adrenal health.
Liked this article, want to learn more?
Book in a free base chat with our practitioners to understand the best diet & lifestyle shifts, herbal or nutritional options for you. All of our practitioners are clinically trained and evidence based registered with Australia’s leading associations.
Follow up on Instagram for more tips, support and fun.
Tags:
Kindara ChartRelated posts

Natural treatments for dysbiosis
Our vaginal microbiome plays a crucial role in overall vaginal he

Fuelling The Vaginal Microbiome Blog
What is the vaginal microbiome? Much like the gut, the vagina has